I. Current Market Development: A Phased Misalignment of Technological Advantages and Industrialization Progress
1. Global Market Landscape and Regional Dynamics
According to the International Renewable Energy Agency (IRENA), the global water electrolysis equipment market reached a scale of $1.28 billion in 2023. Proton Exchange Membrane (PEM) electrolyzers accounted for approximately 18.7% of this market, an increase of 3.2 percentage points from 2022. As an industry pioneer, US-based Plug Power recently secured a 3 GW order for the AGA project in Australia and is involved in the construction of a Sustainable Aviation Fuel (SAF) project in Uzbekistan. However, its Q3 2023 financial report revealed an expanded net loss of $283 million and a debt-to-asset ratio climbing to 68%, reflecting the high-cost pressures during the initial phase of technology industrialization. In the European market, the H2V Normandy project, a collaboration between Germany’s Siemens Energy and France’s Air Liquide, plans to construct a 1 GW-scale PEM electrolysis system. The project has received €450 million in funding from the EU Innovation Fund, signaling market expansion driven by policy.
2. Analysis of Domestic Industrialization Progress in China
Data from the China Hydrogen Alliance Research Institute shows that 27 new green hydrogen projects were approved in the first half of 2023, with a total investment exceeding ¥140 billion, corresponding to an electrolyzer demand of over 1.5 GW. Currently, alkaline electrolyzers (ALK) still dominate the market with a share of over 94%. PEM electrolyzers are primarily used in demonstration projects. For instance, the Daye City renewable energy hydrogen production project is equipped with a 2×200 Nm³/h PEM electrolysis system, supported by 6 MW of photovoltaic power. Similarly, the “Green Power + Green Hydrogen + Green Ammonia” integrated project in Baicheng, Jilin Province, utilizes a 1×200 Nm³/h PEM unit. Both projects serve as technology validation platforms. According to estimates from the Gaogong Industry Research Institute (GGII), domestic shipments of PEM electrolyzers in 2023 were approximately 42 MW, with a penetration rate of less than 5%, indicating that the industrialization process significantly lags behind policy expectations.
II. Techno-Economic Bottlenecks and Industrial Chain Maturity Assessment
1. Analysis of Core Component Technology Bottlenecks
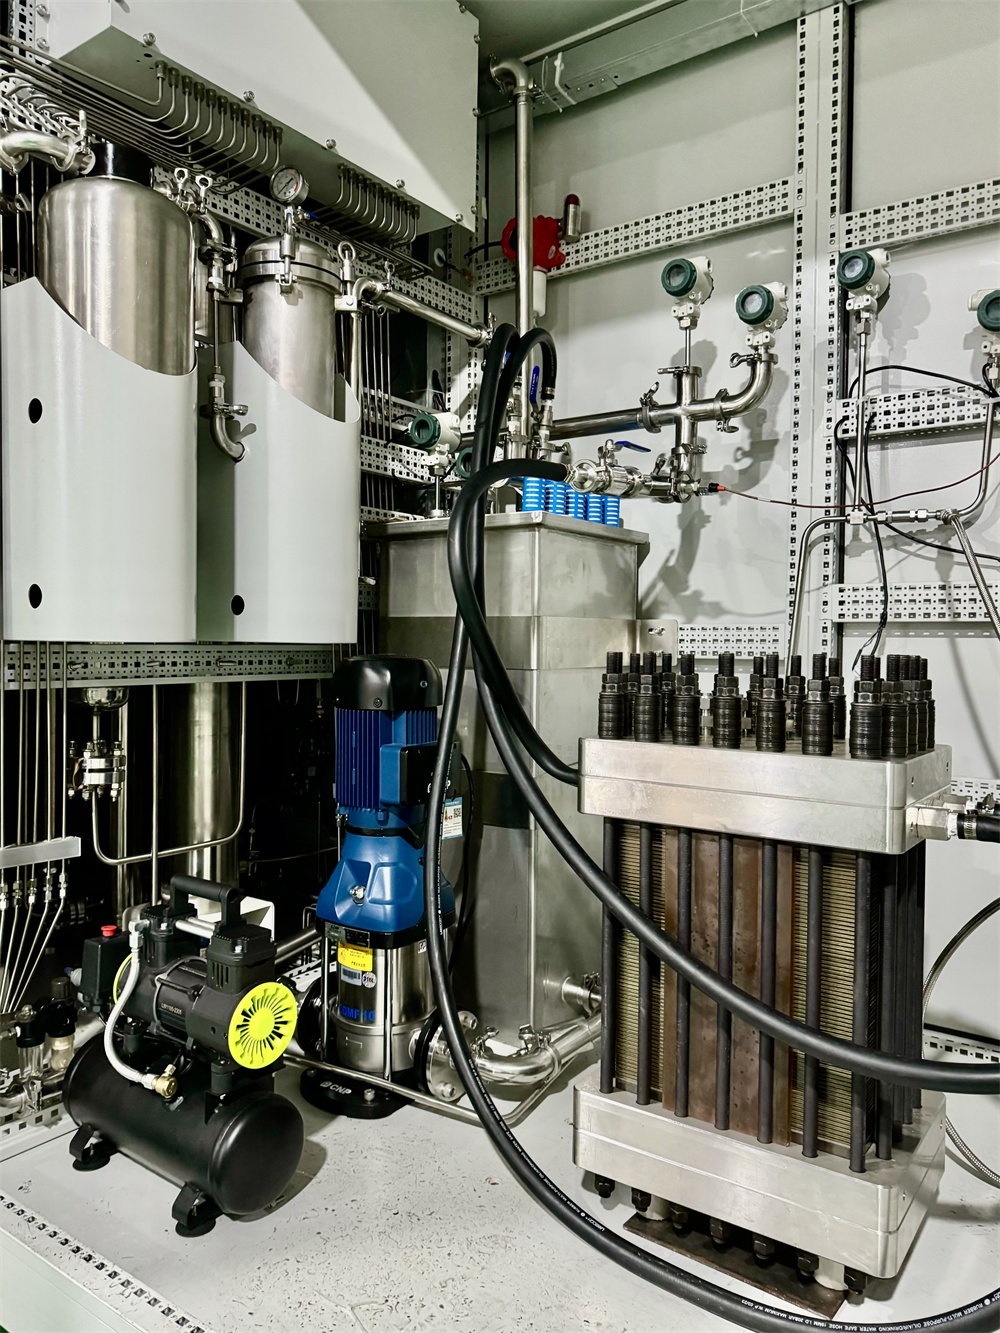
(1) Catalyst Dependency Challenge: The anode’s Oxygen Evolution Reaction (OER) requires iridium-based catalysts. Current commercial catalysts have an iridium loading of 1.5-2.0 mg/cm². According to the U.S. Geological Survey (2023 data), the global annual production of iridium is approximately 7.3 tons. Based on the projected demand for 100 GW of electrolyzers by 2030, the iridium demand gap will reach 7.8 tons. Hefei Momentum Conservation Co., Ltd. has developed a gradient sputtering deposition technology that reduces iridium loading to 0.8 mg/cm² and has localized the production of the Porous Transport Layer (PTL) through its SP-PTL mass production line. However, the fabrication of the Catalyst Coated Membrane (CCM) still relies on imported equipment.
(2) Durability Constraints: Accelerated stress tests show that the dissolution rate of anode Ir³⁺ reaches 5.3 μg/(cm²·h) under 1.6V operating conditions, leading to an annual degradation rate of over 8%. After operating for 6,000 hours at 80°C and 1.5 A/cm², the fluoride ion release from the perfluorosulfonic acid proton membrane reaches 12 ppm, causing a 23% decrease in proton conductivity.
2. Status of Industrial Chain Collaborative Development
(1) Localization Rate of Upstream Materials: The processing precision of titanium-based bipolar plates has reached ±5μm (the national standard requires ±15μm), but the precious metal coating on the surface still relies on patented technology from Hitachi Metals. In terms of proton membranes, Dongyue Group’s TF-1215 membrane product has a surface density of 180μm and a proton conductivity of 0.13 S/cm, performance close to Chemours’ Nafion™ membrane, but batch-to-batch stability remains a challenge.
(2) Manufacturing Cost Structure Analysis: According to Fraunhofer ISE calculations, in the current cost structure of PEM electrolyzers, the Membrane Electrode Assembly (MEA) accounts for 38%, bipolar plates for 21%, and catalysts for 15%. Scale production could reduce system costs from $1200/kW to $800/kW (in a 5 GW capacity scenario), but this requires solving key issues such as precious metal recycling technology (current recovery rate <65%) and high-speed roll-to-roll coating processes (coating speed needs to increase from 0.5 m/min to 5 m/min).
III. Commercial Application Scenarios and Market Driving Mechanisms
1. Dual-Drive Mechanism of Policy and Market (1) International Policy Framework: The EU’s Renewable Energy Directive (RED III) explicitly requires that 42% of hydrogen used in the industrial sector must come from renewable sources by 2030. Germany’s H2Global program has established a €2.3 billion special fund for green hydrogen imports. (2) Domestic Policy System: The “Medium and Long-Term Plan for the Development of the Hydrogen Energy Industry (2021-2035)” aims to build a green hydrogen production capacity of 100,000-200,000 tons/year by 2025, corresponding to an electrolyzer demand of 5-10 GW. Regions like Inner Mongolia and Ningxia have introduced green hydrogen subsidy policies, providing operational subsidies of ¥0.8-1.2 per kilogram based on production volume, which can increase the IRR by 2.3 percentage points.
2. Economic Assessment of Typical Application Scenarios
(1) Off-Grid Hydrogen Production: In Class III wind and solar resource areas (2200 annual utilization hours), a supporting PEM electrolysis system can increase the utilization rate of curtailed electricity to 92% (compared to 78% for alkaline electrolyzers). When the electricity cost is below ¥0.25/kWh, the hydrogen production cost can be controlled at ¥18.7/kg.
(2) Chemical Industry Coupling: Taking a 600,000 tons/year synthetic ammonia project as an example, using PEM electrolyzer-produced hydrogen to replace natural gas reforming results in a carbon emission reduction of 2.2 tons of CO₂ per ton of ammonia. Calculated at a carbon price of €50/ton, the annual revenue increases by €66 million.
IV. Evolution of Competitive Landscape and Market Penetration Pathways
1. Analysis of Technology Route Substitution Risk Breakthroughs have been made in the development of hybrid Alkaline-Anion Exchange Membrane (AEM) electrolyzers. Test data from the 718th Research Institute of CSSC show that at a current density of 2 A/cm², the AEM system’s voltage drops to 1.85V with an efficiency of 75%, without the need for precious metal catalysts. If its durability exceeds 10,000 hours, it will pose a substitution threat to PEM technology.
2. Phased Market Penetration Goals
(1) Short-term Breakthrough Period (2024-2026): Focus on breakthroughs in 10 MW-class system integration technology, with demonstration projects achieving over 20,000 hours of cumulative operation. Promote the development of technology liability insurance products by insurance institutions.
(2) Scale Expansion Period (2027-2030): Reduce supply chain risks through vertical integration models (e.g., PLUG Power building its own catalyst factory). The goal is to reduce iridium usage to 0.3 g/kW and compress equipment costs to $600/kW.
(3) Mature Application Period (2031-2035): Achieve GW-level delivery capability, increase market share to 35%, and realize a Levelized Cost of Hydrogen (LCOH) of ¥14.6/kg under the baseline scenario in sectors like steel and chemicals.
V. Investment Recommendations and Risk Management Strategies
1. Industrial Investment Value Matrix
(1) Priority Tracks: Proton membrane manufacturing (technology premium rate of 45%), precision machining of ultra-thin titanium plates (domestic substitution market space of ¥3.2 billion), and fluctuating power source coupling control technology (patent barrier index of 8.7).
(2) Risk Alerts: Price volatility of precious metals (Iridium price standard deviation reaching $980/oz), technological iteration of alkaline electrolyzers (current density breaking through 0.5 A/cm²), and delays in the green hydrogen certification system (over 60% of projects unable to connect to the grid due to certification issues).
2. Construction of Risk Hedging Mechanisms
(1) Financial Instrument Innovation: Promote equipment financial leasing models (increasing the residual value guarantee rate to 75%) and pilot green hydrogen futures products (the Shanghai Futures Exchange has already initiated research).
(2) Policy Coordination Pathways: Advocate for the inclusion of PEM electrolyzers in the “First Set (Unit) of Major Technical Equipment Insurance Compensation Catalog,” increasing the premium subsidy ratio to 90%.
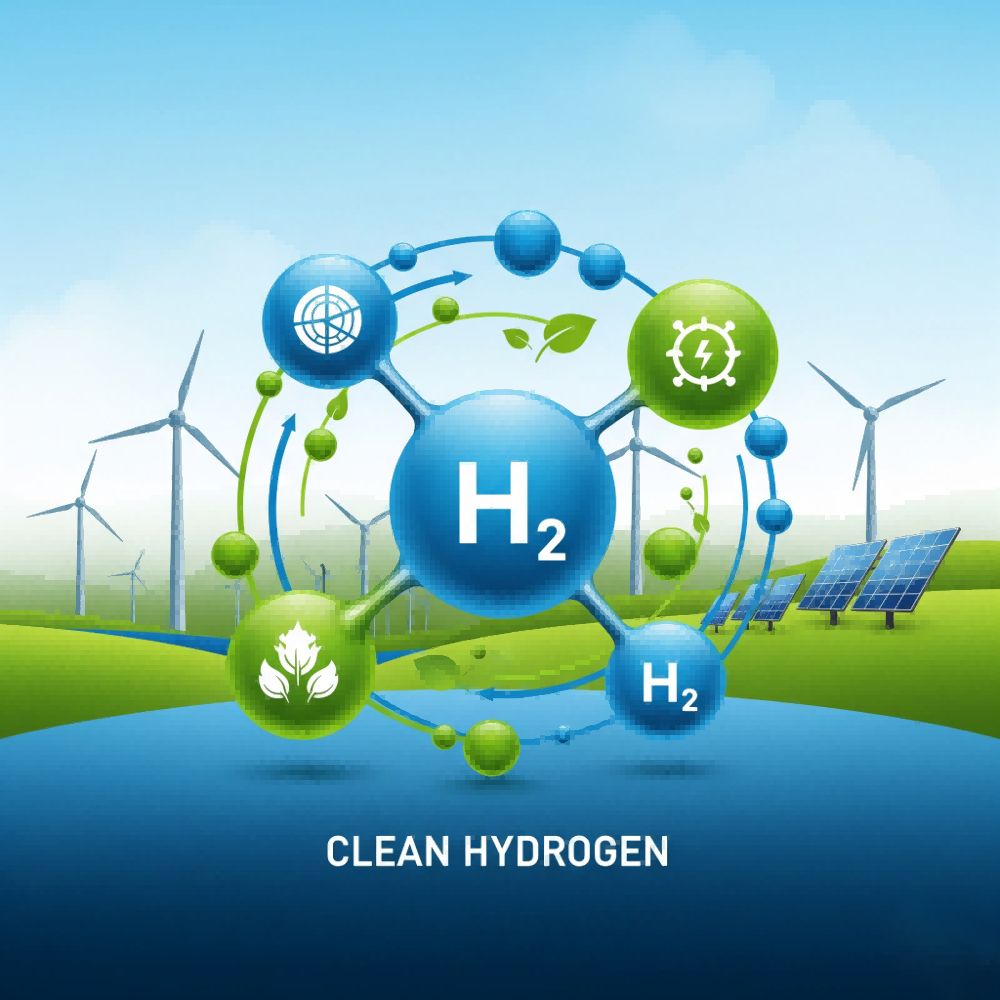
Green Hydrogen Revolution: Visualizing the Path to a Cleaner Energy Future
The burgeoning field of green hydrogen is poised to reshape the global energy landscape, offering a clean and versatile alternative to fossil fuels. This technological push is multifaceted, involving advancements in electrolyzer technology, a rapidly expanding global market, significant material and cost hurdles, and a clear roadmap toward large-scale commercialization. Here, we explore these four key aspects through a series of illustrative prompts.
FAQs:
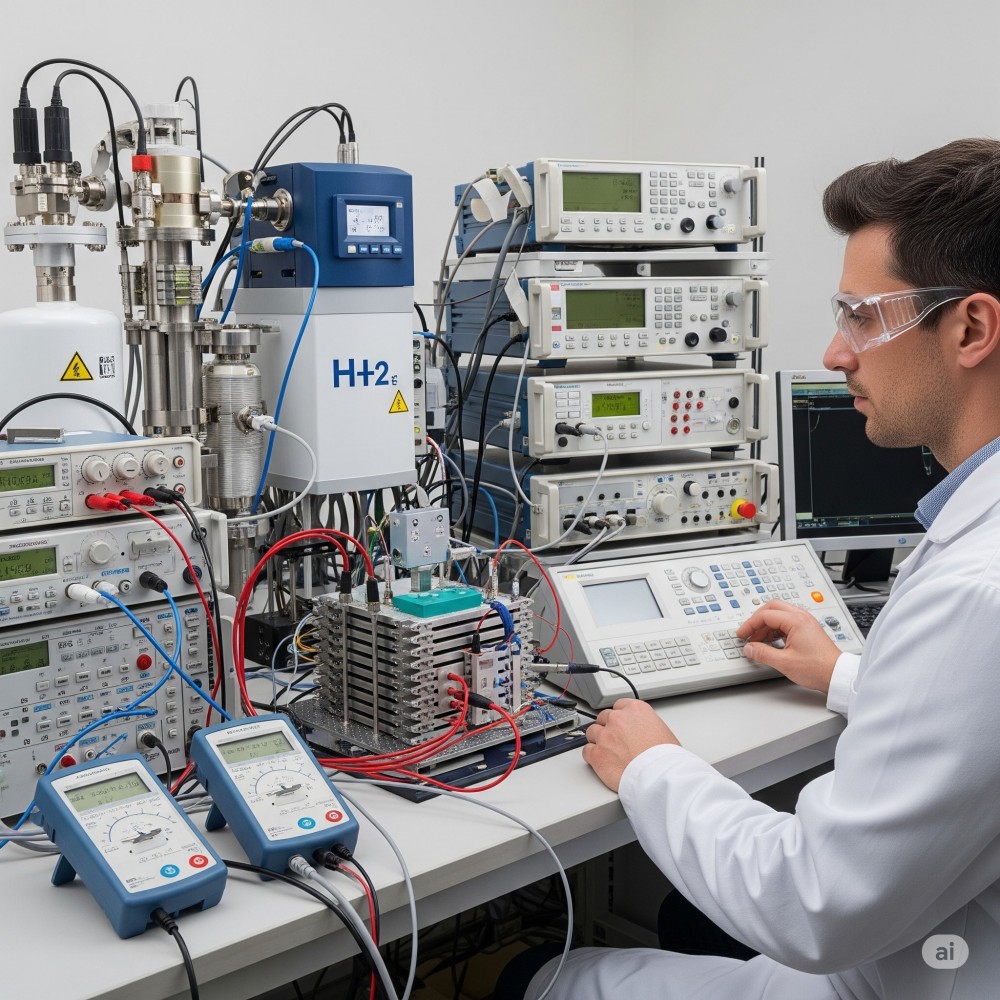
1. PEM Electrolyzer Technology: The Heart of Green Hydrogen Production
At the core of green hydrogen production lies the Proton Exchange Membrane (PEM) electrolyzer. An infographic would reveal the cell’s intricate workings, showcasing the flow of water ($H_2O$) to the anode. Here, a catalyst, typically made of precious metals like iridium or ruthenium, splits the water molecules into oxygen ($O_2$), protons ($H^+$), and electrons ($e^-$). The protons then pass through the central, catalyst-coated membrane to the cathode, while the electrons travel through an external circuit. At the cathode, a platinum-based catalyst facilitates the reaction between the protons and electrons to form pure hydrogen gas ($H_2$). Key to this process are the porous transport layers, often composed of titanium felt at the anode and carbon paper at the cathode, which ensure the efficient delivery of water and removal of the resulting gases.
2. A Burgeoning Global Market: Green Hydrogen’s Expanding Reach
The global green hydrogen market is on a trajectory of exponential growth, with projections indicating a market size of over $25 billion by 2029. A visual representation of this expansion would feature a world map with interconnected nodes, symbolizing the burgeoning trade and collaboration in this sector. Icons representing key industrial applications would be prominently displayed. These would include symbols for renewable energy storage, where green hydrogen can store excess wind and solar power for later use; sustainable aviation fuel (SAF) production, highlighting its role in decarbonizing air travel; and chemical manufacturing, where it serves as a clean feedstock for producing ammonia, methanol, and other essential chemicals. The visual would underscore the pivotal role of green hydrogen in decarbonizing heavy industry and transportation.
3. The Iridium Bottleneck: A Critical Cost and Materials Challenge
Despite its promise, the widespread adoption of PEM electrolyzer technology faces a significant hurdle: its dependence on the rare and costly precious metal, Iridium (Ir). An illustrative graphic would depict the chemical symbol for Iridium alongside a volatile price chart, showcasing its dramatic price fluctuations and recent highs of around $156 per gram. Further emphasizing the challenge, the image would include data on the constrained global supply, with an annual production of only 7-8 metric tons. This scarcity is a major bottleneck, as current technology requires approximately 400 kilograms of iridium to produce one gigawatt of electrolyzer capacity, and the metal can account for 20-25% of the total stack cost. This dependency poses a significant challenge to cost reduction and rapid scaling.
4. The Road to 2035: A Vision for GW-Scale Commercialization
Looking ahead, the future of green hydrogen hinges on achieving gigawatt-scale commercialization by 2035. A futuristic concept image would portray a vast, automated electrolyzer manufacturing facility, a “Gigafactory” for the green hydrogen age. This imagery would symbolize the industry’s ambitious goals: drastic cost reductions in green hydrogen production, with targets aiming for as low as $2.5 per kilogram by 2030; significant improvements in electrolyzer efficiency and durability; and a massive ramp-up in manufacturing capacity to meet the soaring global demand. This vision of a streamlined and scaled-up production process represents the ultimate goal of making green hydrogen a cost-competitive and readily available cornerstone of a sustainable global economy.
(Data in this report is sourced from the World Platinum Investment Council, China Hydrogen Alliance, European Patent Office databases, and on-site corporate research. Sensitivity analysis was conducted using Monte Carlo simulations. Detailed model parameters can be found in the appendix.)